In this guide, we’ll break down the different chart types, how they work, and how to read them so you can make smarter trading choices.
Forex charts help you see how currency prices move over time. They show patterns and trends so you can plan smart trades instead of guessing. Studies show that 70% of new traders lose money because they don’t know how to read charts. When you understand chart basics, you can spot good trades, manage risks, and avoid scams. Learn to read forex charts and you’ll trade with more confidence and better results.
When you understand how to read Forex charts, you’re no longer guessing. You’re watching price action with clear eyes. This helps you spot trends, plan entries and exits, and manage risk wisely.
Learning to read charts also builds confidence. Instead of trusting rumors or random tips, you use facts and patterns to decide when to trade.
A Forex chart is a picture of how one currency's price changes against another over time. It is a story told through lines and shapes.
On every Forex chart, you see:
- Price: On the right, showing the currency pair's
- value.Time: At the bottom, showing when price changes happened.
These two parts help you see how currency values move over minutes, hours, days, or weeks.
Every Forex trade involves a currency pair, like EUR/USD. EUR is the base currency, and USD is the quote currency. The chart shows how much quote currency you need for one base currency unit. This is the exchange rate.
Price moves in tiny steps called pips. A pip is usually the fourth decimal place (0.0001) for most pairs, or the second (0.01) for Japanese Yen pairs. Pips help you track profit or loss.
The spread is another key idea. It is the difference between the bid price (what you sell for) and the ask price (what you buy for). This small cost is how brokers make money, and a smaller spread is better for traders.
So, Forex trading graphs show the constant dance between the bid and ask prices of a currency pair, displayed across time.Forex charts come in different styles. Each one shows the same thing, price over time, but in its own way. Let’s look at the four main ones traders use.
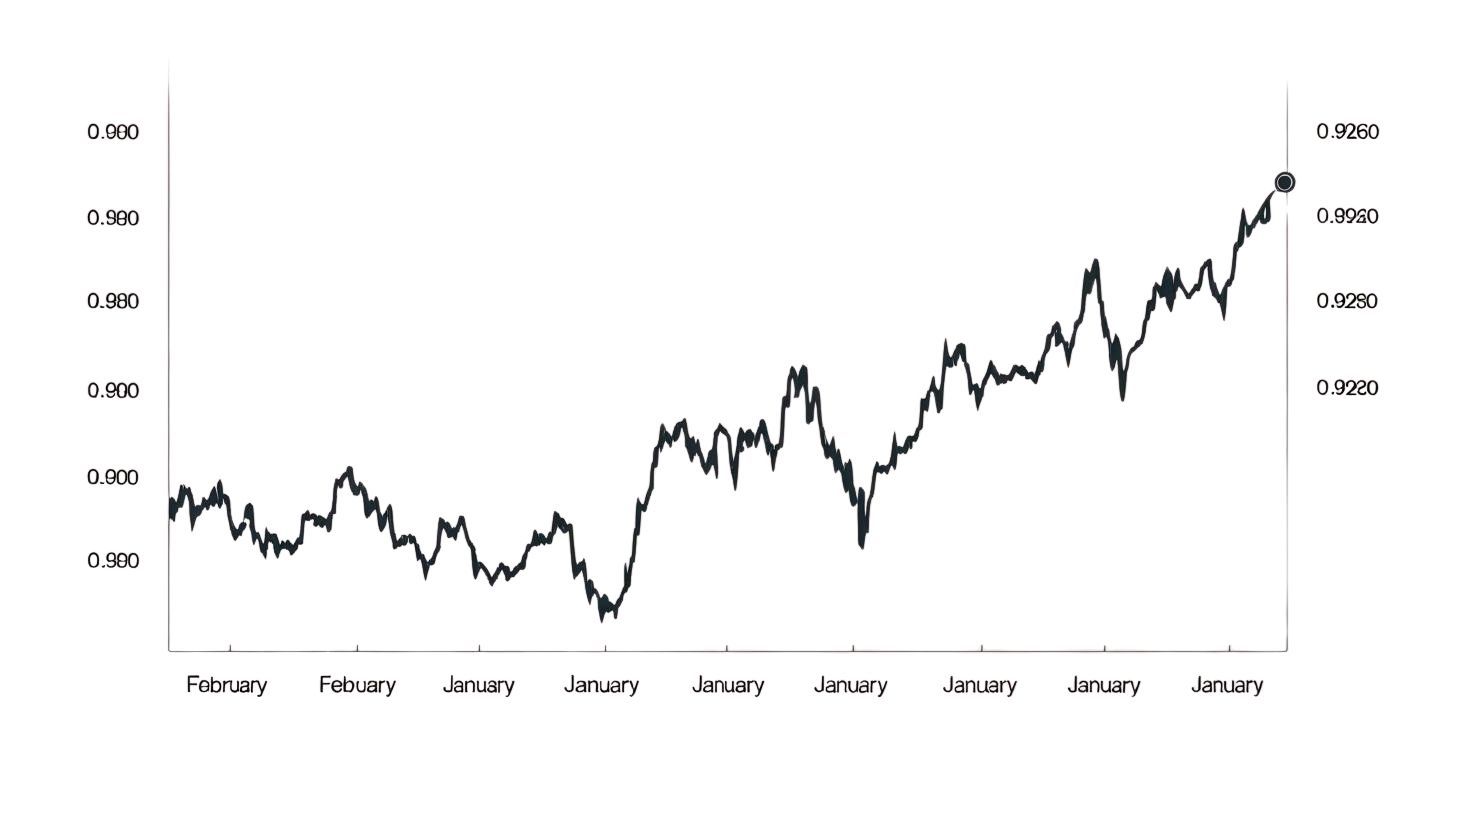
A line chart is the simplest way to see price movement. It plots a single line that connects the closing prices of a currency pair over time.
Line charts are great for spotting the overall trend. If the line goes up, prices are rising. If it goes down, prices are falling. Many beginners like line charts because they’re clean and easy to follow.
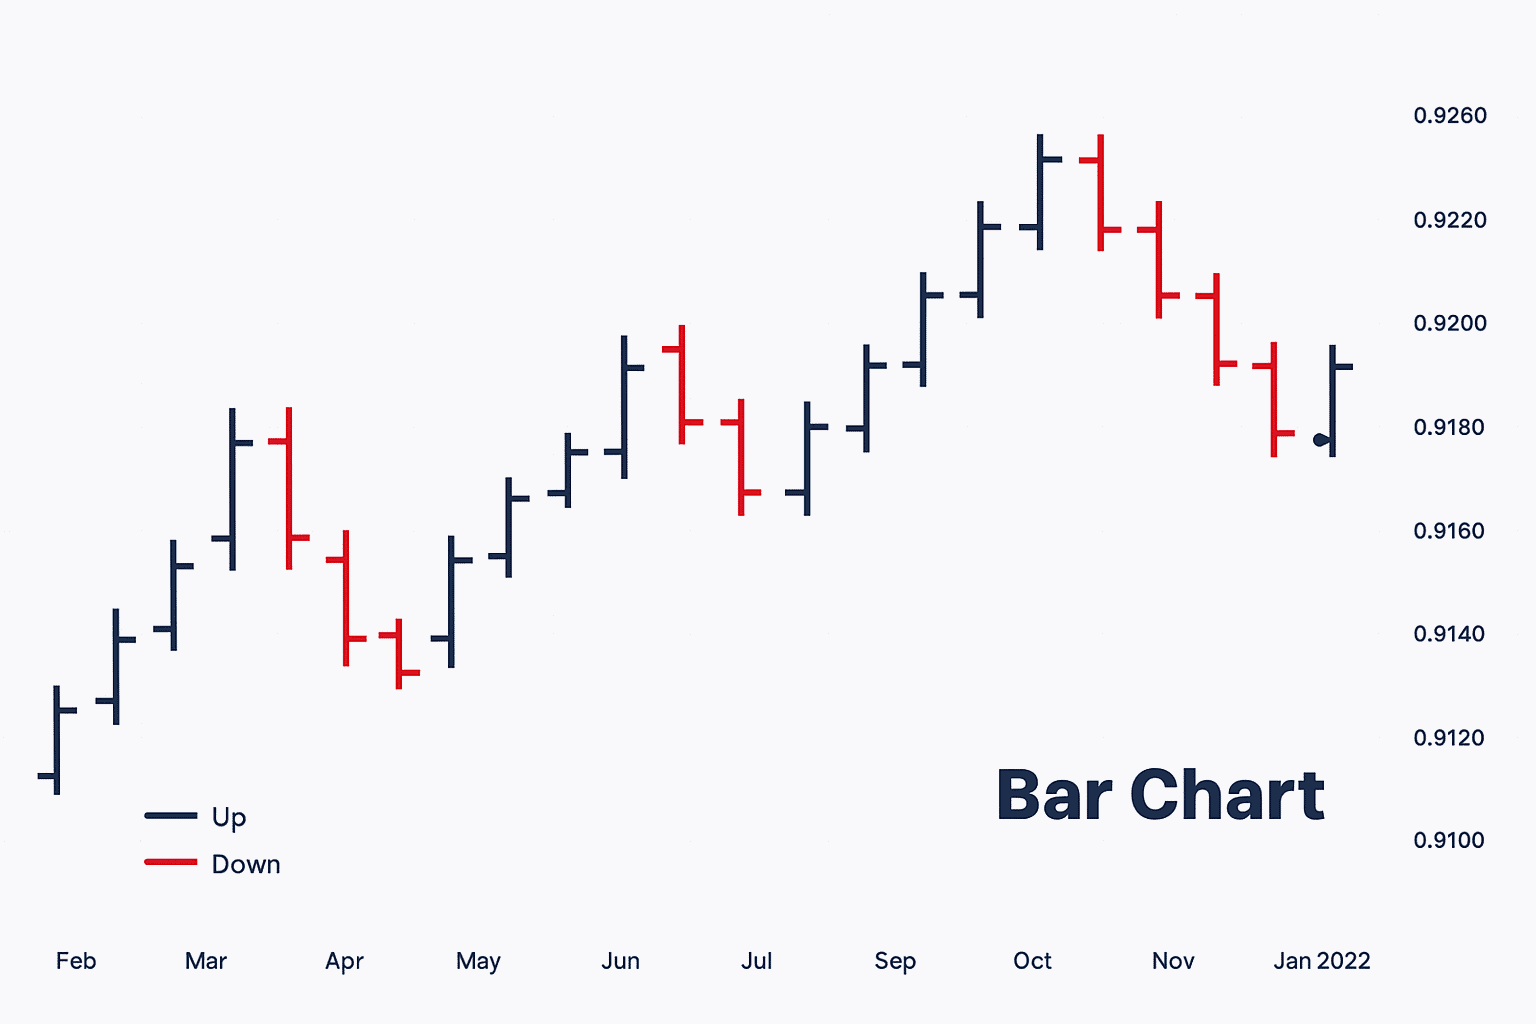
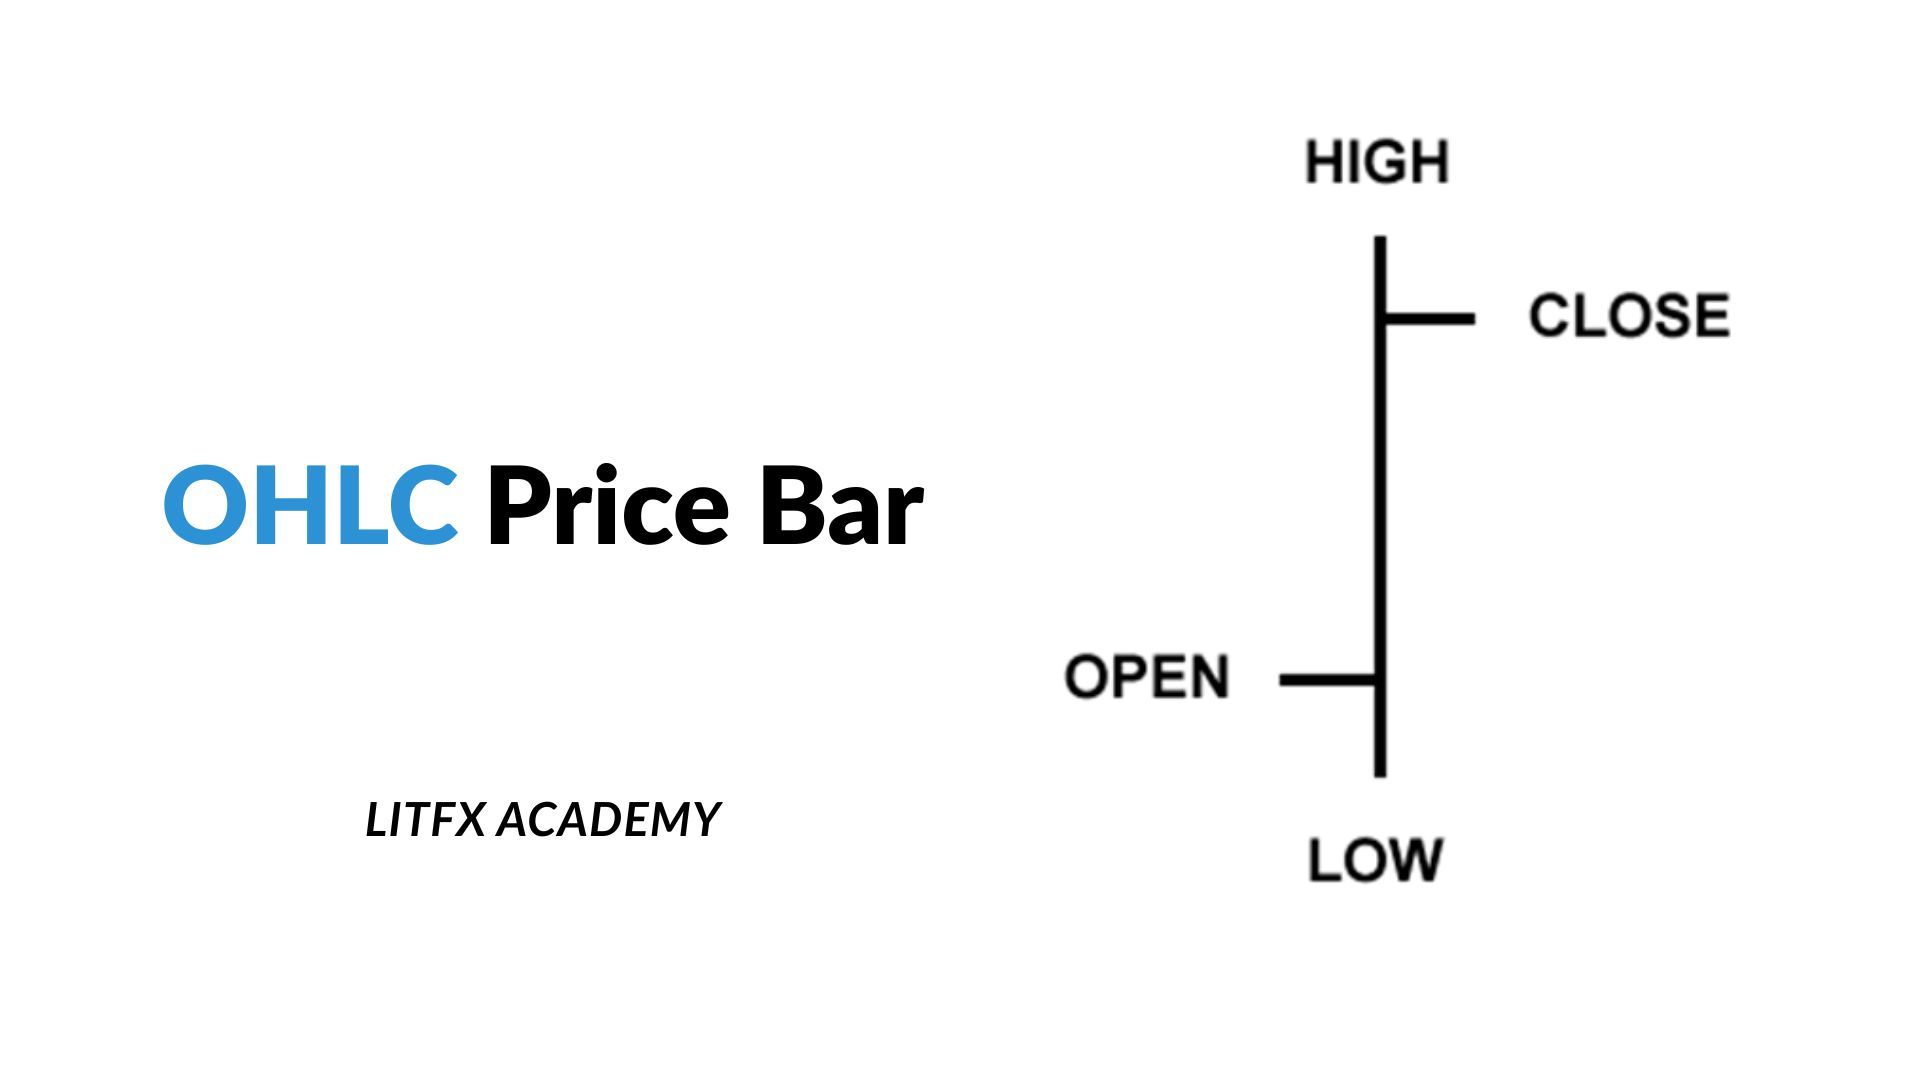
A bar chart gives you more detail than a line chart. Each “bar” shows four important things:
- Open: The horizontal line on the left side of the bar shows the price when the period started.
- High: The very top of the vertical bar shows the highest price reached during that period
- Low: The very bottom of the vertical bar shows the lowest price reached during that period.
- Close: The horizontal line on the right side of the bar shows the price when the period ended.
What it shows: Open, high, low, and close prices for each period.
When to use it: Bar charts give you a better sense of price range and volatility within each period. You can see if the price moved a lot or a little, and where it ended up compared to where it started. They are a step up in detail for interpreting Forex price charts.
A vertical line shows the high and low, and small horizontal lines on the side show the open (left) and close (right). Bar charts help you see where prices moved within a time period, not just where they closed.
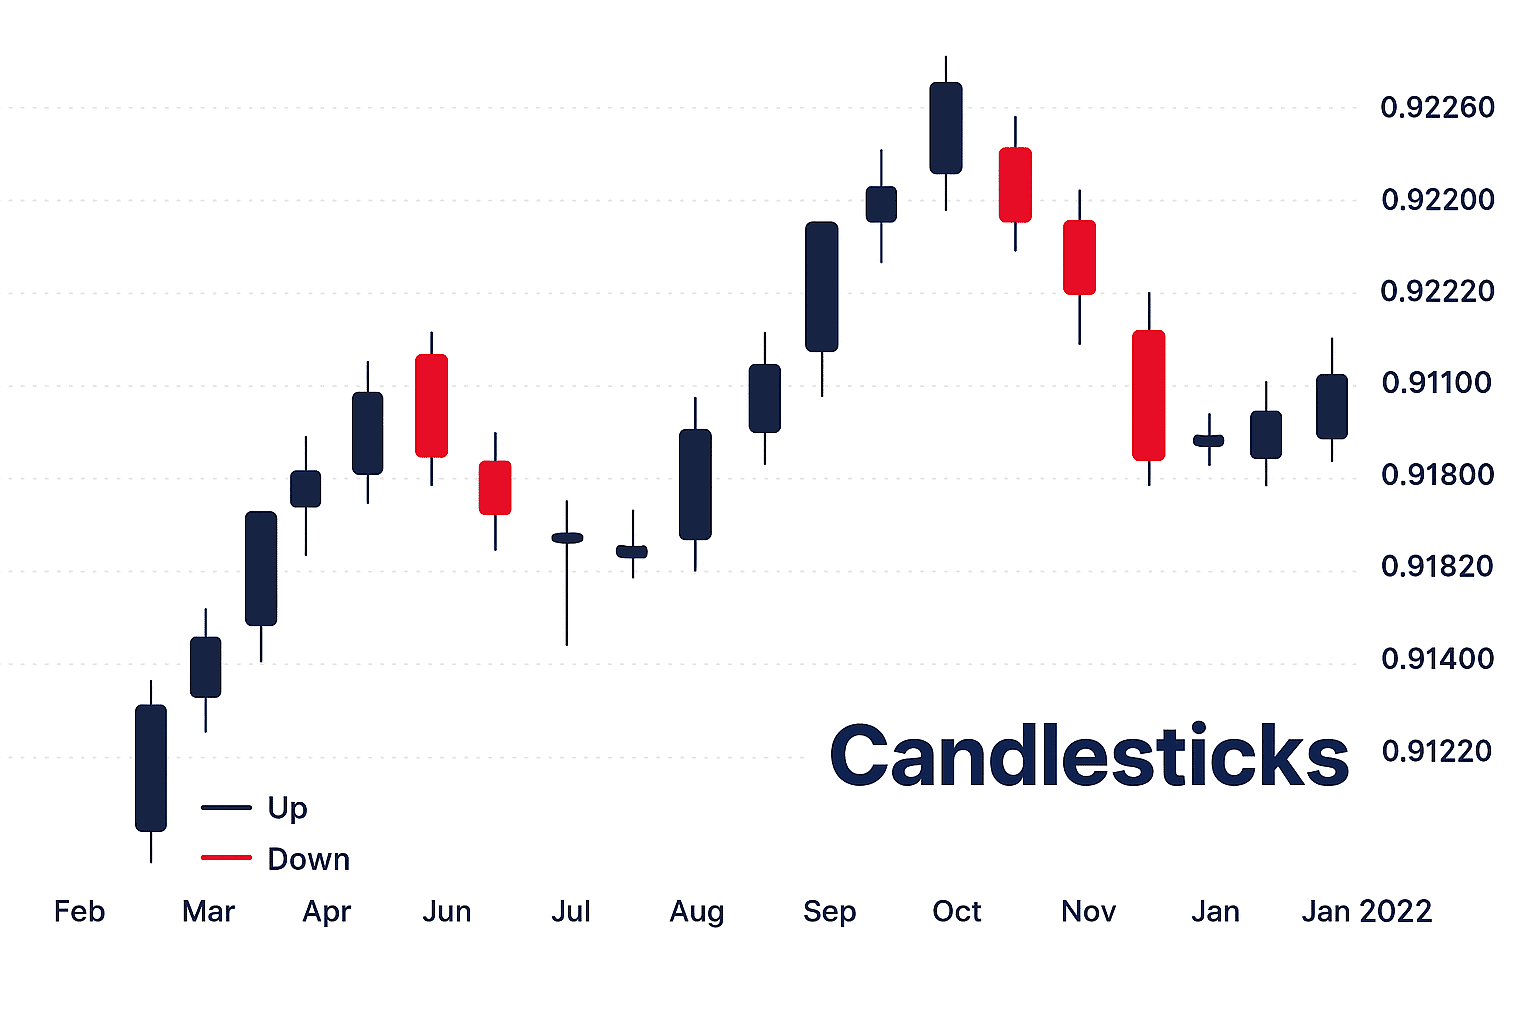
The candlestick chart is by far the most popular type of chart used by Forex traders. Why? Because it packs a lot of information into a very visual and easy-to-understand format. Each "candlestick" represents a period of time, just like a bar. But they are colored and shaped in a way that makes them much easier to read at a glance.
Each candlestick has two main parts:
1. The Real Body: This thick part shows the difference between the open and close prices. If the close is higher, it's a green (or white) bullish candle (price went up). If the close is lower, it's a red (or black) bearish candle (price went down).
2. The Shadows (or Wicks): These thin lines extend above and below the body. The top of the upper shadow is the high price, and the bottom of the lower shadow is the low price for that period.
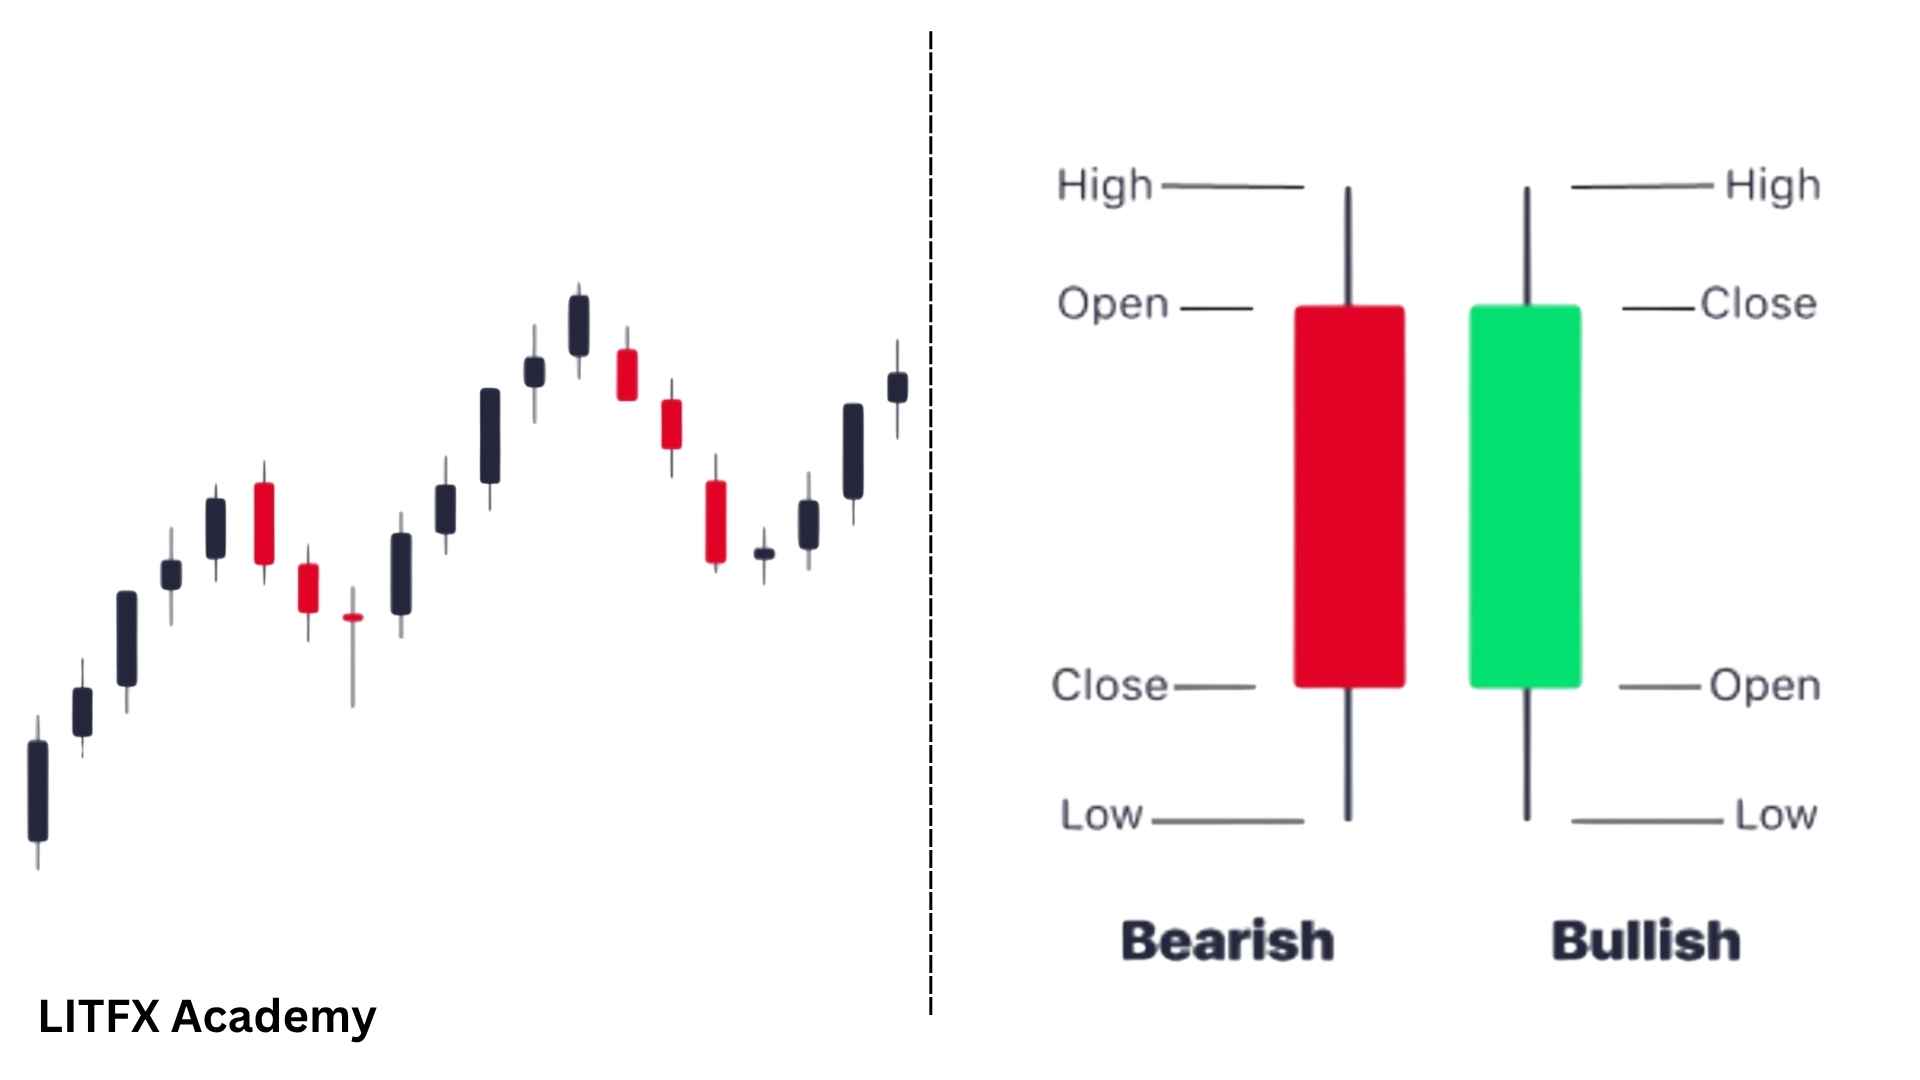
Candlestick patterns help traders spot trends and possible reversals fast. Learning how to read candlestick charts is a skill every Forex trader should have.
A tick chart is for short-term traders who want to see every tiny move. Instead of showing price over regular time periods like minutes or hours, a tick chart plots price changes for every single trade (or tick) that happens.
Scalpers and day traders sometimes use tick charts to make quick decisions in fast-moving markets.
Now that you know the main chart types, let’s break down what you’ll see on any Forex chart. Understanding these parts makes reading any chart much easier.
When you look at a Forex chart, you choose a
timeframe. This setting tells you how much time each line, bar, or candlestick represents. Common timeframes include:
- M1 (1 Minute): Each candle shows price movement over one minute.
- M5 (5 Minutes): Each candle shows price movement over five minutes.
- H1 (1 Hour): Each candle shows price movement over one hour.
- H4 (4 Hours): Each candle shows price movement over four hours.
- D1 (1 Day): Each candle shows price movement over one day.
- W1 (1 Week): Each candle shows price movement over one week.
- MN (1 Month): Each candle shows price movement over one month.
Pick your timeframe based on how long you want to hold your trades.
👉 Pro Tip: Farrukh Otajonov explains this clearly in his training video, how to mark a key level on H1 and confirm the trade idea on M5 and M1 for safer entries.
In Forex, you’re always trading two currencies. The first is the base currency, and the second is the quote currency. For example, in EUR/USD, the euro is the base, and the dollar is the quote.
Charts show how much of the quote currency you need to buy one unit of the base.
- Bid Price: The price you can sell the base currency for.
- Ask Price (Offer Price): The price you can buy the base currency for.
- Spread: The small difference between bid and ask. Brokers make money from this.
Every chart has two sides:
- The Y-axis shows the price.
- The X-axis shows time.
Simple but powerful — these two lines let you track price changes over time.
In spot Forex, volume is not always shown the same way as in stock trading, but some platforms show tick volume (number of price changes). Volume can help confirm trends: higher volume often means stronger moves.
One of the most important things on a Forex chart is the trend, the general direction the price is moving over time. Think of it like the flow of a river. Trading with the trend is usually easier and less risky than going against it.
There are three main types of trends:
Uptrend (Bullish Trend): The price moves upward, making higher highs and higher lows. It looks like a staircase going up, showing buyers are pushing prices higher.
Downtrend (Bearish Trend): The price moves downward, making lower highs and lower lows. It looks like a staircase going down, showing sellers are driving prices lower.
Sideways Trend (Range-bound): The price moves back and forth within a range, like a ball bouncing between two walls. Buyers and sellers are evenly matched.
Spotting the trend helps you decide when to buy or sell. In an uptrend, look for buy chances. In a downtrend, look for sell chances. Trend confirmation often uses other tools, which we’ll cover next.
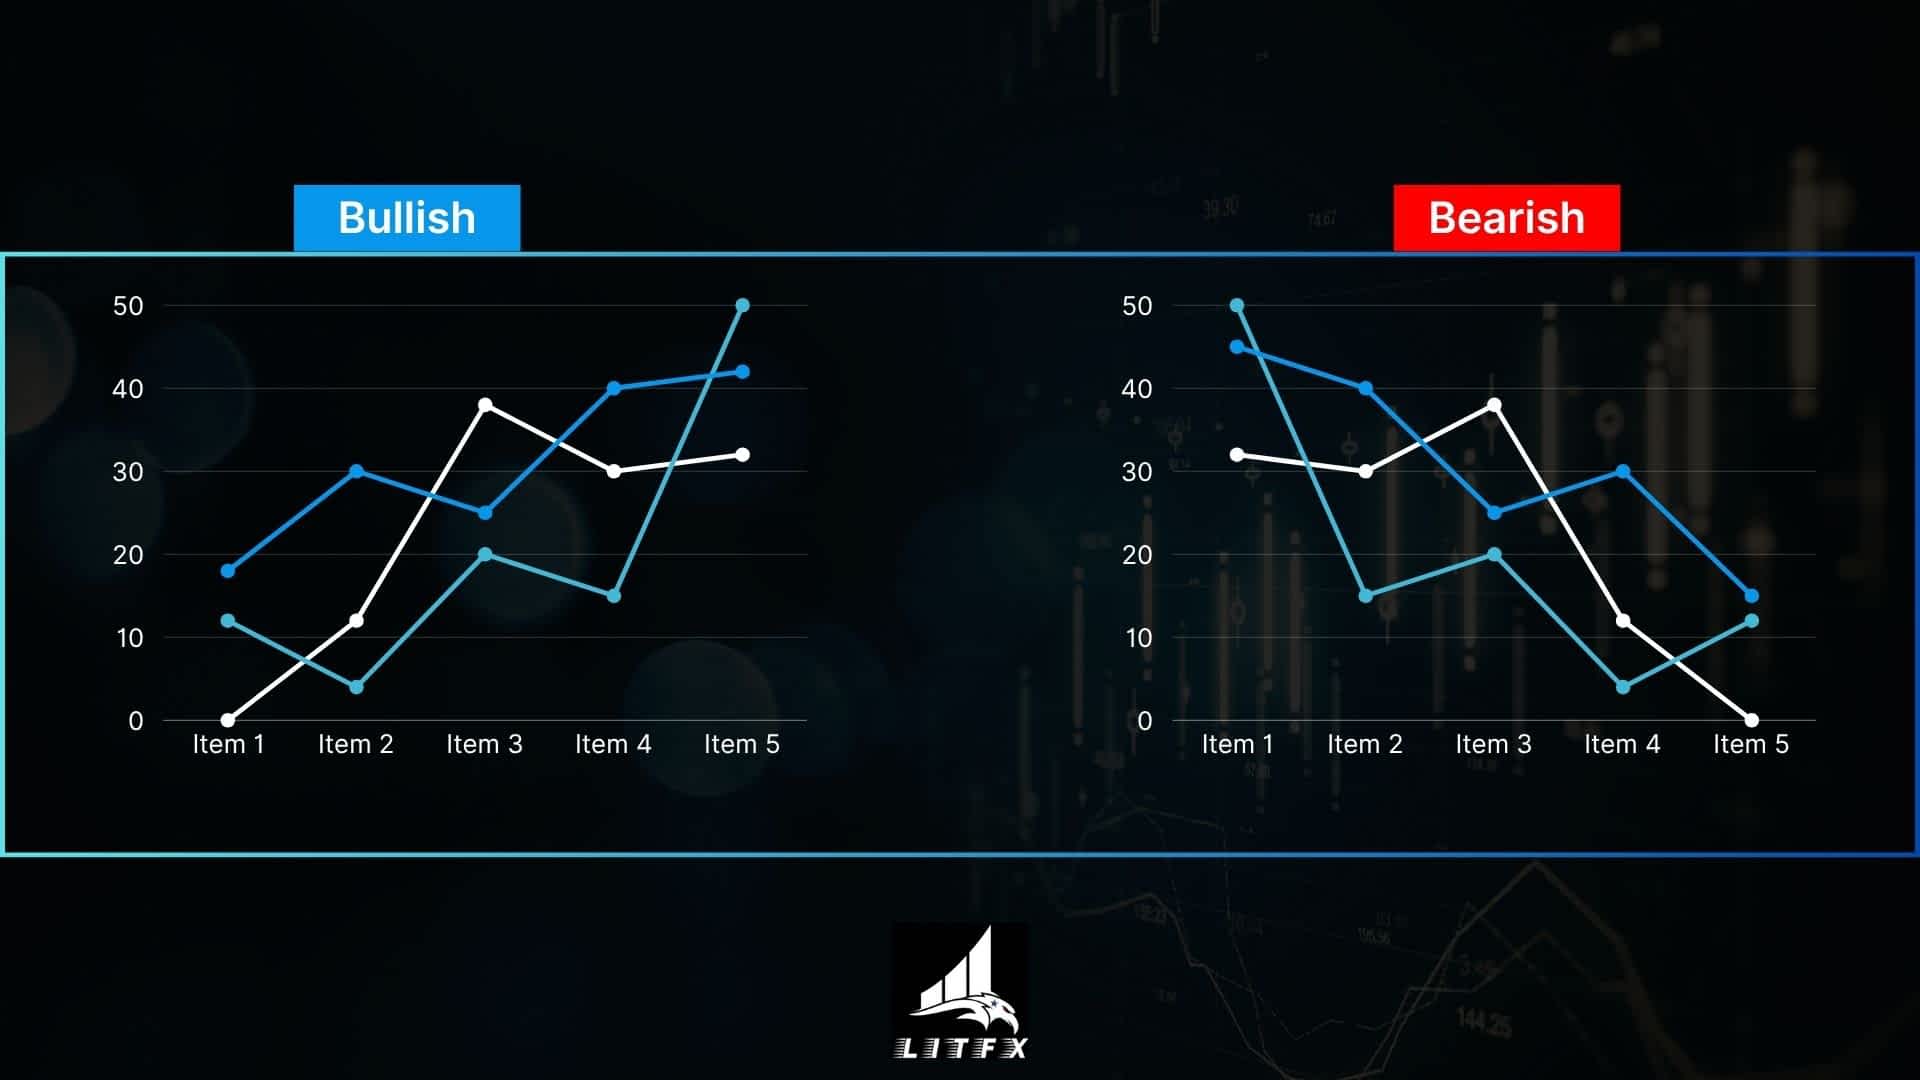
A big part of reading forex charts is finding trends and patterns that predict price movements. Trends show the direction prices are moving—up (bullish), down (bearish), or sideways (range-bound). Spotting trends helps you decide whether to buy or sell.
Support is a price level where a currency pair often stops falling and starts rising, like a floor. Resistance is where it stops rising and starts falling, like a ceiling. For example, if EUR/USD keeps bouncing up at 1.05, that’s support. Identifying these levels on forex trading charts helps you plan trades.
👉 Pro Tip: Farrukh Otajonov explains in his video how marking these levels using the OHLC method instead of the traditional supply or order block way can help you avoid fake breakouts and hidden traps.
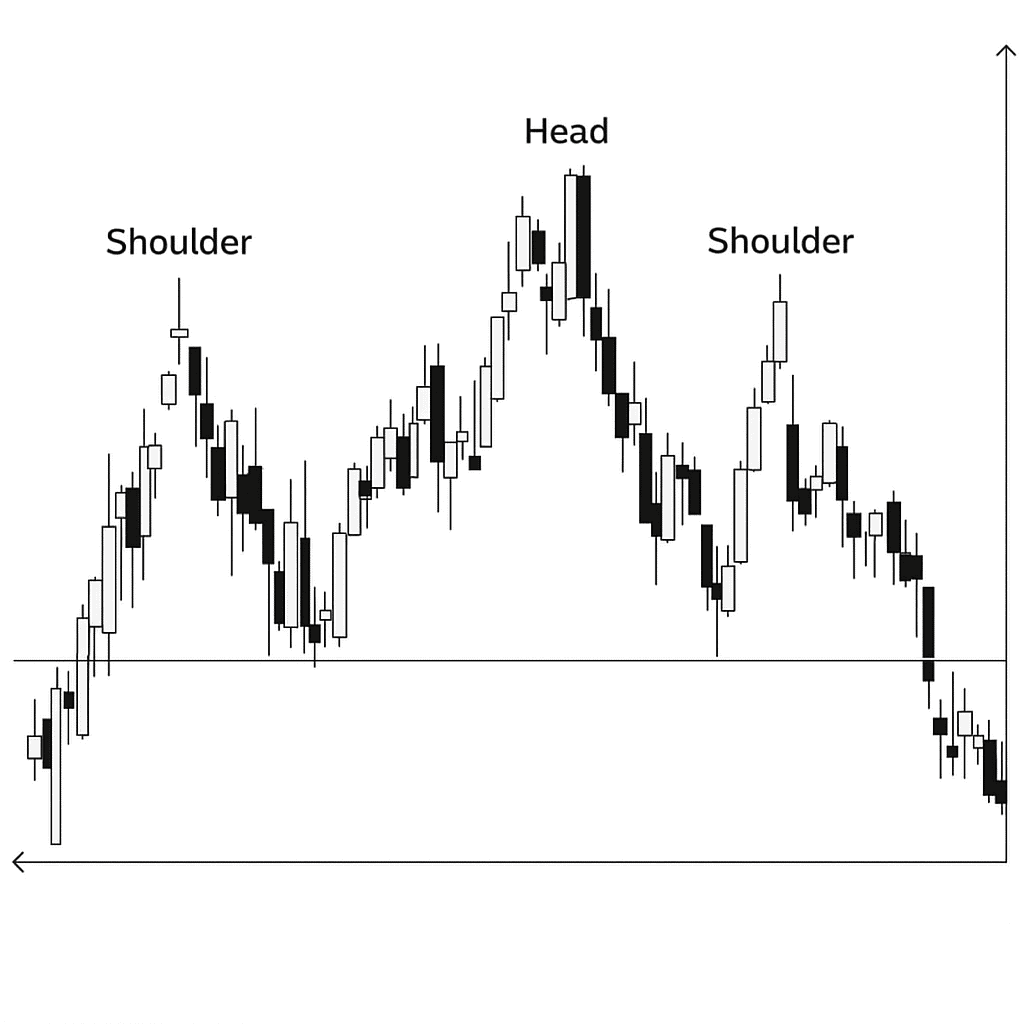
Chart patterns are shapes that hint at future price moves. Common ones include:
Head and Shoulders: This pattern looks like — you guessed it — a head with two shoulders. It shows that an uptrend might be ending. When the “neckline” breaks, traders expect price to fall
Triangles: Prices form a triangle shape, often leading to a big breakout. These patterns (Symmetrical, Ascending, Descending) show price narrowing in a range, forming a triangle. They often mean the market is pausing before continuing its previous direction. A breakout from the triangle can signal continuation.
Double Top/Bottom: These patterns signal a potential trend reversal. A Double Top (M-shape) suggests an uptrend is losing steam, as price hits resistance twice before falling. A Double Bottom (W-shape) suggests a downtrend is ending, as price hits support twice before rising.
Understanding these simple patterns can add another layer to your Forex chart reading. They are not foolproof, but they can help you anticipate potential price moves.
Forex charts are useful, and
technical indicators help understand price movements better. They act as special tools to reveal patterns or confirm suspicions.
Indicators are shown as
overlays on the chart or
oscillators in a separate window. Here are common ones:
- Moving Averages (Overlays): A line that smooths price data. It helps see the general trend (price above average suggests uptrend, below suggests downtrend) and can act as dynamic support or resistance.
- Relative Strength Index (RSI) (Oscillator): Moves between 0 and 100, showing if a currency pair is "overbought" (above 70, might fall) or "oversold" (below 30, might rise). It hints at reversals but is best used with other tools.
- Moving Average Convergence Divergence (MACD) (Oscillator): Shows price momentum and trend changes using two moving averages. Crossing lines can signal a trend change, and histogram height shows trend strength. It's good for trend confirmation and spotting divergence.
These are just a few examples. Understand what each indicator tells you and use them together for a clearer Forex market visualization.
Did you know price action changes through the day? The Forex market runs 24 hours, but not every hour has the same energy.
The main trading sessions:
- Asian Session: Starts with Tokyo.
- London Session: Big moves, high liquidity.
- New York Session: Overlaps London for even more activity.
Many traders check which session they’re in before reading charts. This helps them expect more or less volatility.
Knowing the best time to trade is a big plus. For more, read Best
Time to Trade Forex to match your charts with the busiest times.
Learning how to read Forex charts takes practice, but it’s a skill that can open the door to smarter trades and better results. Focus on understanding trends, patterns, and indicators step by step.
Being able to interpret these currency charts explained in detail means you can make more informed decisions about when to buy, when to sell, and how to manage your risk. This knowledge is not just about making money; it is also about protecting your investments and ensuring safe Forex trading. Just as you learned in our guide on
how to avoid Forex scams, knowledge and caution are your best defenses.